
There are 2 types of users of table:
- One that quickly look at it to find its information and move on
- One that works extensively with the table
While most UI guides online recommend a lean design, without the clutter of a big table with numbers, I will explain how to design a simple html table for power users.
A. Who ? Why ?
If you want to design applications for:
- accountants
- meteorologist
- or anybody needing to look at a lot of number
They will need to have all of them in front. That means that you need to think about how to display efficiently and nicely a table with a lot of data.
At that point, nice UI and neat presentation are not on the agenda, when you work 8 hours on tables and data, you need to be efficient and not to scroll endlessly to access what you want or worse, have to constantly filter all the data you are interested in.
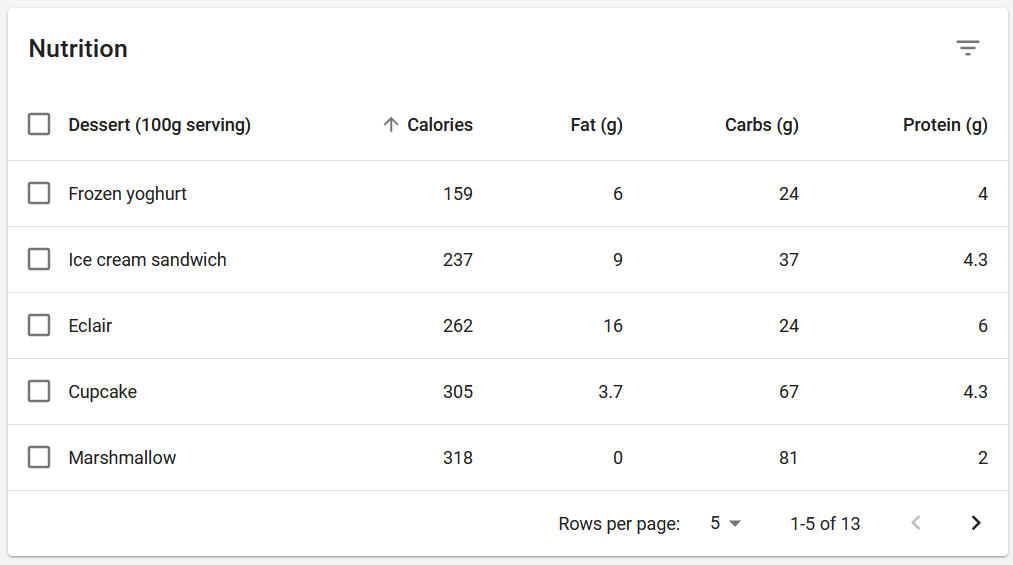
This example of RefactoringUI is for me a bit too reductive, and can apply to quick view of your website or limited data interactions. Notice the increase in size of the table too:

This to me, is a perfect table for a website that doesn't require a lot of interactions with tables. Think of something like a reservation for a hotel or booking your flight tickets. But not for spending time on it.
B. FiveThirtyEight ft. Michael Jordan
Usually you will find big tables on specialised platform and enterprise software. However I found that https://fivethirtyeight.com/ has actually done the best job in terms of table design ! And for a a news outlet.
Here is an example from their website, which does a good job at big tables, look at cropped example in a Michael Jordan's article : Why Michael Jordan Was The Best

While here we are looking at a table of a news website, we can derive a good idea to build our own tables. This is enough for making something readable and with a lot of information.
Let's dive into our interpretation.
C. Do you want to build a table ?
I will expand from the FiveThirtyEight example and show my interpretation of a good table.
One of the few good features to display a lot of data is to merely... Have a smaller cells and letters, so I would recommend to reduce the font size of the table (use the rem unit to scale them depending on the size of your website font size):
table {
	/*Some other properties...*/
    font-size: 0.7rem;
}
In general I like the idea of having the head of the table as uppercase words and maybe slightly bigger to make them stick out better, so nothing too complicated, we can just style the head of the table with this:
th {
    /*Some other properties...*/
    font-size: .8rem;
    text-transform: uppercase;
}
To top it, here, nothing too fancy, just a hover with a slight alpha layer on the table rows. We want something to be applied only to the body of the table and have neat table rows. And voila:
tbody>tr::hover {
    background-color: rgba(155,155,155,.2);
}
And here is our table:
| Date | Open | High | Low | Close | Adj Close | Volume |
|---|---|---|---|---|---|---|
| 2020-03-19 | 19900 | 20393 | 18834 | 19853 | 19853 | 239922 |
| 2020-03-20 | 19583 | 20882 | 18825 | 19875 | 19875 | 285733 |
| 2020-03-22 | 18504 | 18507 | 18086 | 18238 | 18238 | 204991 |
| 2020-03-23 | 18230 | 19804 | 18088 | 18745 | 18745 | 119535345 |
| 2020-03-24 | 18987 | 20943 | 18925 | 20511 | 20511 | 106863898 |
| 2020-03-25 | 20446 | 21892 | 20279 | 21100 | 21100 | 130872632 |
| 2020-03-26 | 20998 | 22545 | 20510 | 22492 | 22492 | 123364604 |
| 2020-03-27 | 22123 | 22321 | 21316 | 21410 | 21410 | 98666789 |
| 2020-03-29 | 20926 | 21244 | 20778 | 21213 | 21213 | 711107 |
| 2020-03-30 | 21350 | 22250 | 21153 | 22196 | 22196 | 82143599 |
| 2020-03-31 | 22204 | 22386 | 21470 | 21502 | 21502 | 66006634 |
| 2020-04-01 | 21397 | 21423 | 20648 | 20932 | 20932 | 82218631 |
| 2020-04-02 | 21030 | 21374 | 20500 | 21160 | 21160 | 97616148 |
| 2020-04-03 | 21044 | 21331 | 20740 | 20928 | 20928 | 63241057 |
| 2020-04-06 | 21647 | 22663 | 21620 | 22555 | 22555 | 96739993 |
| 2020-04-07 | 22496 | 23477 | 22300 | 22488 | 22488 | 274505 |
| 2020-04-08 | 22498 | 23426 | 22337 | 23417 | 23417 | 98632961 |
| 2020-04-09 | 23267 | 23889 | 23020 | 23676 | 23676 | 110699818 |
| 2020-04-12 | 23839 | 23911 | 23108 | 23331 | 23331 | 816363 |
| 2020-04-13 | 23295 | 23609 | 22968 | 23368 | 23368 | 66333180 |
| 2020-04-14 | 23621 | 23967 | 23534 | 23843 | 23843 | 75910145 |
| 2020-04-15 | 23757 | 23809 | 23103 | 23211 | 23211 | 81277443 |
| 2020-04-16 | 23265 | 24327 | 23079 | 24157 | 24157 | 94173258 |
| 2020-04-17 | 24239 | 24305 | 23701 | 24151 | 24151 | 105186538 |
| 2020-04-19 | 23944 | 24028 | 23917 | 23970 | 23970 | 284615 |
| 2020-04-20 | 24143 | 24167 | 23441 | 23530 | 23530 | 87221700 |
| 2020-04-21 | 23273 | 23433 | 22814 | 22999 | 22999 | 111731192 |
| 2020-04-23 | 23315 | 23772 | 23233 | 23282 | 23282 | 78882561 |
| 2020-04-24 | 23246 | 23460 | 23166 | 23416 | 23416 | 9038285 |
You can find an example in React and css at this repo: blog-posts.
You can browse the table, identify easily the rows and have plenty of data to display to your users. I think it is a great addition to the components a website could have, and especially if you design something for data savvy people.
I will expand soon on how to add interactivity with the table like pagination and filtering with react-table.
Both tables should exist, though you should strive for understanding what is beneficial to your user. Are they quickly looking for information or looking for deeper knowledge or investigating a situation ?
Now some news about the site
During the second part of 2019 I managed to build this website, piece by piece, to have a look that would suit what I want and some functionalities that I sought for.
One of the main goal is to cover basic statistics and analytics, common programming tasks encountered in life. But above all it is a place where I want to journal issues that I found interesting or small applications that I think could be beneficial - at least - for me and perhaps for others.
Over the Christmas holidays I started to create a small tool to cover basic exploration for data analysis: which techniques are the most useful to uncover hidden gems in your data.
While the tool covers broad scenarii, it doesn't do everything needed for an exploratory analysis. It is rather a good bookmark when you are not sure how to approach a statistical problem.
You can find it at https://www.chevallier.dev/statistics/ and it works by selecting the type of variable you would like to analyse (and it has some of the features of this "big table" !).
I'll make a comprehensive guide in the weeks to come and shall enrich piece by piece.